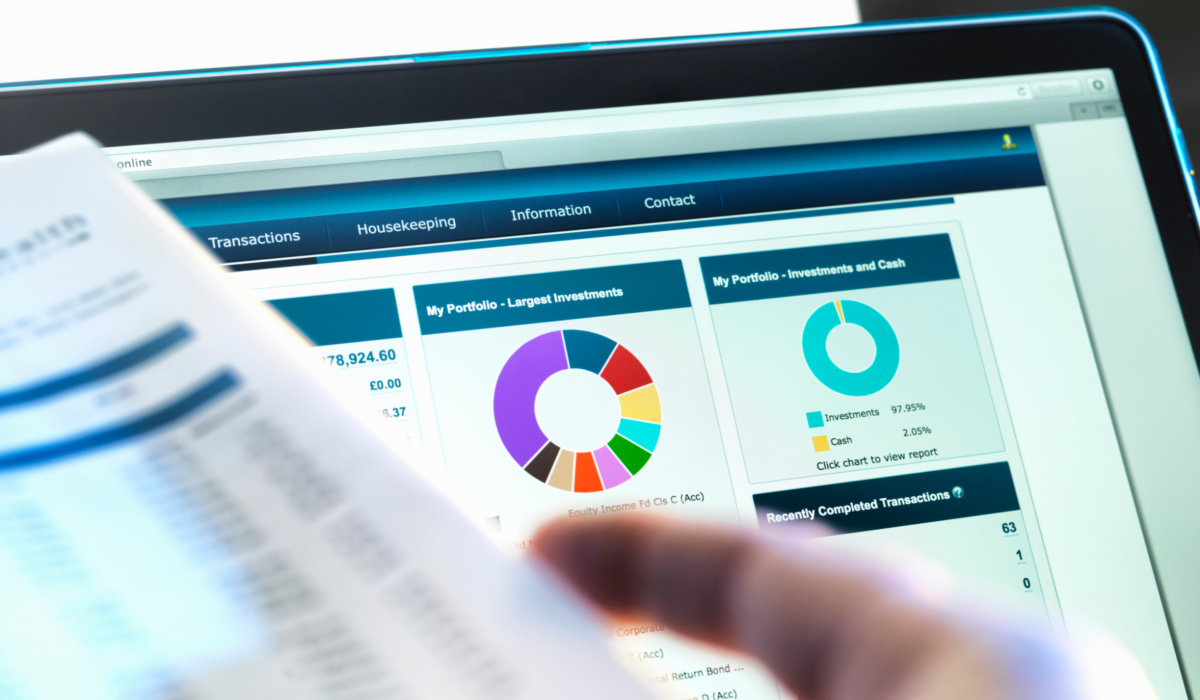
Today, businesses have a wealth of data to exploit. This includes website traffic to social media and lead-generation campaigns. Thanks to the rise of advanced analytics, it’s possible to translate this accumulating data into actionable insights. You can predict future trends, run simulations and optimise business processes.
These steps can help you generate actionable insights from your data on your own to drive your business forward.
Determine your data needs
As most business owners have a wealth of data, the first step in analysis is to narrow the scope – cull irrelevant data and identify a clear purpose and goals for your analysis.
You can do this using the framework of author Max Shron, who suggests establishing the context, needs, vision and intended outcome. This process helps you determine what goals you aim to achieve through analysis, specific needs it will address, a mock-up of results and how they will be integrated into your business.
Online activities to analyse
Most businesses regularly analyse key online activities. What you choose to analyse depends on your digital presence and activity levels.
HubSpot recommends analysing social media, blog, search engine optimisation (SEO) and lead generation activities such as email campaigns to determine the return on investment. This often leads to actionable insights – reporting can spur referrals, identify upselling opportunities and motivate client collaboration.
Key questions to answer when analysing these activities include: which SEO keywords are increasing website traffic and should be targeted? Which blog topics are performing well and is your blog boosting overall site traffic? Is social media increasing website traffic and contributing to leads? Is lead generation converting into sales?
It helps to ensure you have defined goals for online activities and set targets for things such as customer generation.
Create actionable reports
Once you've defined a plan for analysis, the next step is to use analysis and visualisation tools to interpret your data and generate reports. This is critical, as few people can gain actionable insights from looking at raw data. And as Google Analytics advocate Daniel Waisberg notes, the "power of visualisation lies in its ability to display unexpected findings in a clear, easy-to-grasp manner."
One of the most popular tools is Google Analytics, as it’s both powerful and free to use. It can seem complicated for first-timers, but thankfully there are many free training manuals online. You can even choose to report website and social media metrics weekly, quarterly and annually. This can help you track the progress of your digital efforts over a period of time, while also being able to drill down and see monthly or weekly impact.
The key to generating actionable insights is to learn how to analyse data and make suggestions at key points. You want your data reports to include recommendations you can action, such as specific ideas about how to better address customer needs.
When stuck, troubleshoot
To avoid inaccurate analysis when using Google Analytics, you may need to troubleshoot.
Web analyst Himanshu Sharma identified five common mistakes that "kill effective analysis". The following two apply particularly for first-timers trying to use data to drive decision-making:
Directional issues: This is when you find yourself unable to decide which data to track, what to focus on and where to look in analytics reports. It stems from how you’ve set up your Google Analytics account – the various segments, filters and custom reports. To spur decision-making, Sharma recommends establishing how your business is situated and prioritising problems that need addressing, as well as requirements and barriers to solve them. This helps you understand what data needs to be collected and the context in which it should be interpreted.
Data-reporting issues: This is when you find you’re producing reports that can’t be interpreted the way you want. Common mistakes that trigger these issues include reporting trends that are too short – three months or less – not adding annotations on graphics to describe peaks and dips in trend, and producing reports without clear recommendations.
If you get stuck collecting and interpreting data with Google Analytics, Sharma’s extensive list of common issues and solutions may help.
Now you know how to exploit data to drive business decisions. The next step is to determine your needs and the online activities you want to analyse, considering your wider business goals. The sooner you do this, the sooner you’re on the path to producing actionable data reports that can make your goals a reality.


